SPH 302 LESSON 8: Equillibrium between phases
| Institution | TOM MBOYA UNIVERSITY |
| Course | EDUCATION |
| Year | 3rd Year |
| Semester | Unknown |
| Posted By | Brian Mike |
| File Type | |
| Pages | 9 Pages |
| File Size | 410.04 KB |
| Views | 8267 |
| Downloads | 0 |
| Price: |
Buy Now
|
Description
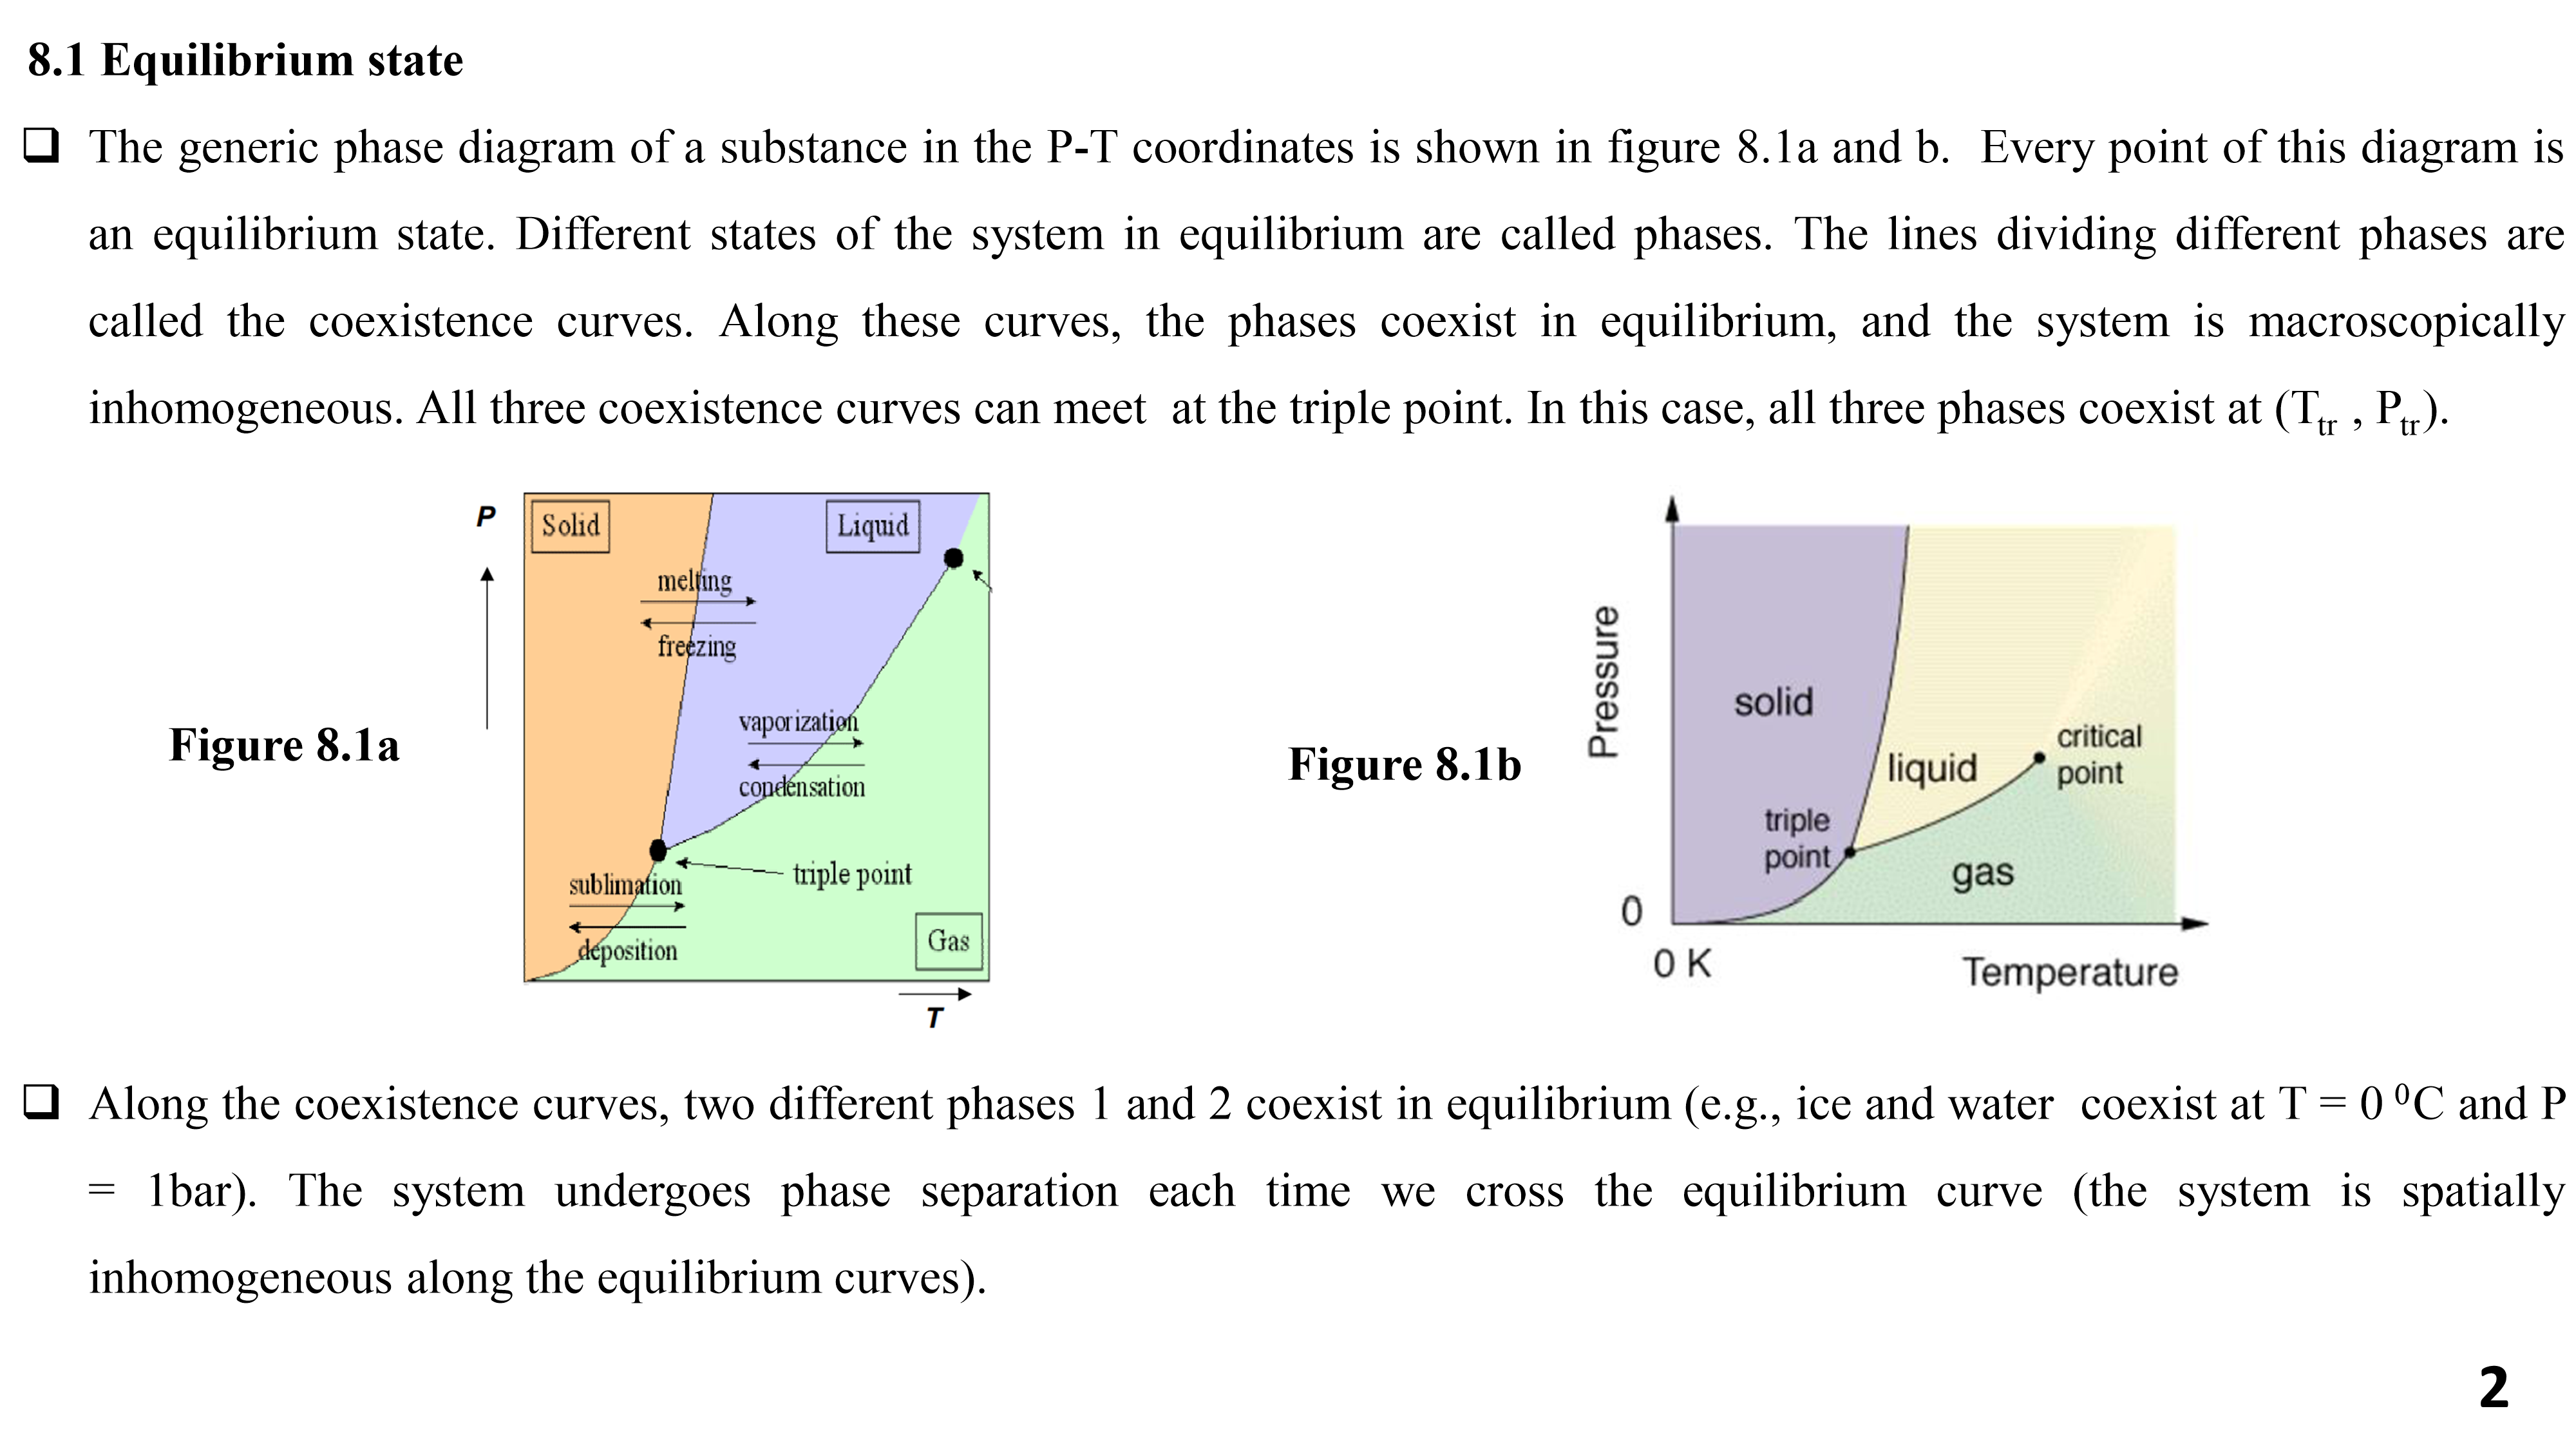
The generic phase diagram of a substance in the P-T coordinates is shown in figure 8.1a and b. Every point of this diagram is an equilibrium state. Different states of the system in equilibrium are called phases. The lines dividing different phases are called the coexistence curves. Along these curves, the phases coexist in equilibrium, and the system is macroscopically inhomogeneous. All three coexistence curves can meet at the triple point.
Below is the document preview.
BBM 114; Fundamentals of Accounting 1
Trending!
Accounting is defined as the process of identifying, measuring and reporting economic information to the users of this information to permit informed judgement.
287 Pages
4889 Views
0 Downloads
736.76 KB
CGA;Agricultural engineering notes
Trending!
Surveying is the art of determining the relative positions of different objects on or below the surface of the earth.
This is done by measuring the horizontal and vertical distances between them, analyzing the data and presenting
them in a suitable form, eg plan, map or report
185 Pages
8115 Views
1 Downloads
5.47 MB
DGA; Soil science Notes Module 1
Trending!
Soil is a dynamic natural body composed of mineral and organic materials, living forms as well as air in which plants grow.
93 Pages
8992 Views
1 Downloads
1.3 MB
DGA; Agricultural engineering 1 Notes Module 1
Trending!
The needs for farm structure varies according to regions, and are greatly influenced by crops grown,
animal kept, markets, building material, local conditions and social economic conditions. Some have a
specific purpose while others may have a multipurpose or dual purpose in their use. How an individual interprets these variables in relation to useful structures may classify farm structures according to their uses,
153 Pages
8498 Views
5 Downloads
553.68 KB
DA:Agricultural extension and sociology notes Module 1
Trending!
This subject unit aims at imparting the trainee with knowledge and skills that will help them understand how rural families and societies make decisions and receive information about agriculture. It will also provide the trainee with an understanding on how to use wisely the resources at home.
245 Pages
8065 Views
0 Downloads
3.14 MB
BEE KEEPING AND HARVESTING NOTES
Trending!
Beekeeping is widely practiced in South Africa, Egypt, Kenya and Tanzania, but is less well known in other parts of Africa. Honey is a key ingredient for a local type of beer as well as being consumed as a food, while beeswax is used for making candles and creams.
20 Pages
8865 Views
0 Downloads
595.58 KB
CROP PRODUCTION NOTES
Agriculture means cultivation of the land for the purpose of producing crops and management of livestock. It also involves the storage, processing and marketing of agricultural products.
87 Pages
469 Views
0 Downloads
976.93 KB
Agriculture Grade 7 Term 1,2,3 Notes
Trending!
Download a copy of Agriculture Grade 7 Term 1,2,3 Notes. The notes are precise, complete and comprehensive. This will serve you well!
80 Pages
9033 Views
5 Downloads
2.38 MB
Human Resource Management- Personnel Administration Notes
Trending!
HR policies are continuing guidelines on the approach the organization intends to adopt in managing its people. They define the philosophies and values of the organization on how people should be treated
77 Pages
8491 Views
0 Downloads
946.34 KB
FOOD AND BEVERAGE PRODUCTION THEORY NOTES
Trending!
This unit is intended to impart in trainees cooking skills and attitudes required for professional cookery. It gives the trainees a broad knowledge of raw food materials and their application in food production.
106 Pages
11166 Views
12 Downloads
715.64 KB