SPH 302 LESSON 8: Equillibrium between phases
| Institution | TOM MBOYA UNIVERSITY |
| Course | EDUCATION |
| Year | 3rd Year |
| Semester | Unknown |
| Posted By | Brian Mike |
| File Type | |
| Pages | 9 Pages |
| File Size | 410.04 KB |
| Views | 8285 |
| Downloads | 0 |
| Price: |
Buy Now
 Buy via
whatsapp Buy via
whatsapp
|


Description
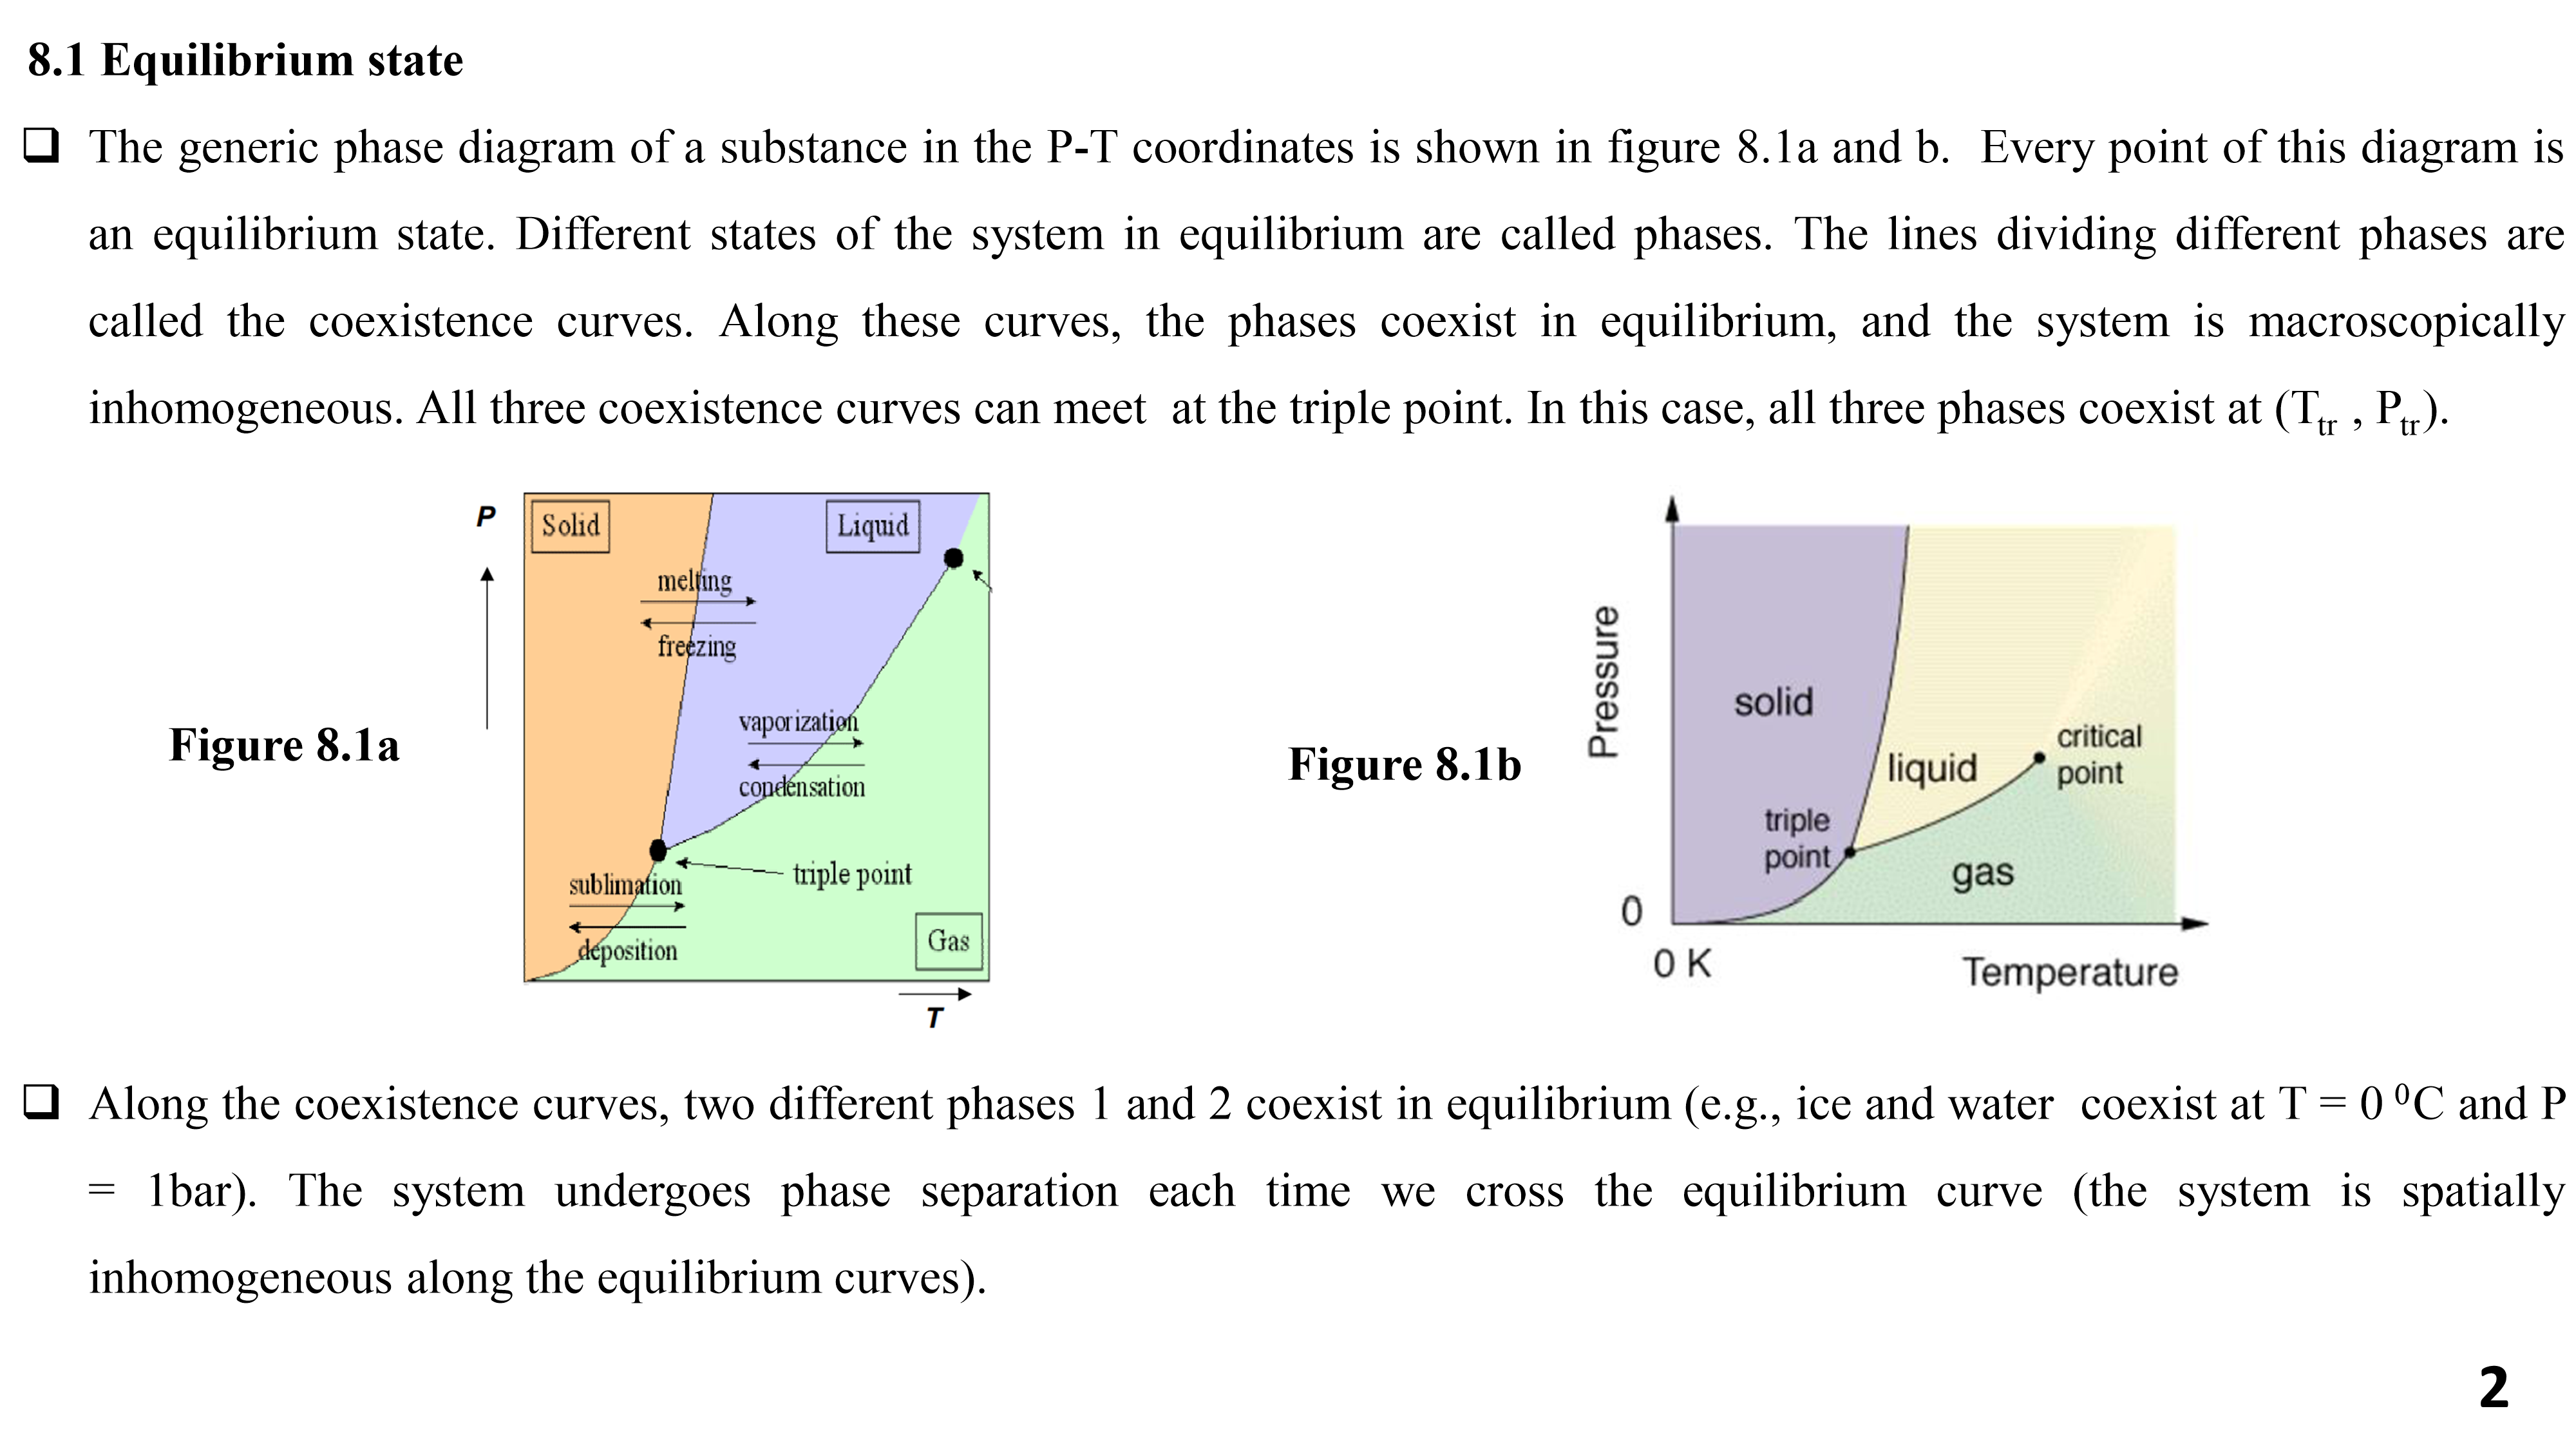
The generic phase diagram of a substance in the P-T coordinates is shown in figure 8.1a and b. Every point of this diagram is an equilibrium state. Different states of the system in equilibrium are called phases. The lines dividing different phases are called the coexistence curves. Along these curves, the phases coexist in equilibrium, and the system is macroscopically inhomogeneous. All three coexistence curves can meet at the triple point.
Below is the document preview.

BAC 413 Marketing Financial Services
Trending!
Simple And Direct
35 Pages
5815 Views
0 Downloads
947.59 KB
EET 100 Introduction to Microeconomics
Trending!
Simple and Clear
139 Pages
5669 Views
2 Downloads
1.97 MB
BMS 404 Econometric Models and Methods
Trending!
Simple and Clear
58 Pages
6494 Views
1 Downloads
1.25 MB