SPH 302 LESSON 8: Equillibrium between phases
| Institution | TOM MBOYA UNIVERSITY |
| Course | EDUCATION |
| Year | 3rd Year |
| Semester | Unknown |
| Posted By | Brian Mike |
| File Type | |
| Pages | 9 Pages |
| File Size | 410.04 KB |
| Views | 8039 |
| Downloads | 0 |
| Price: |
Buy Now
|
Description
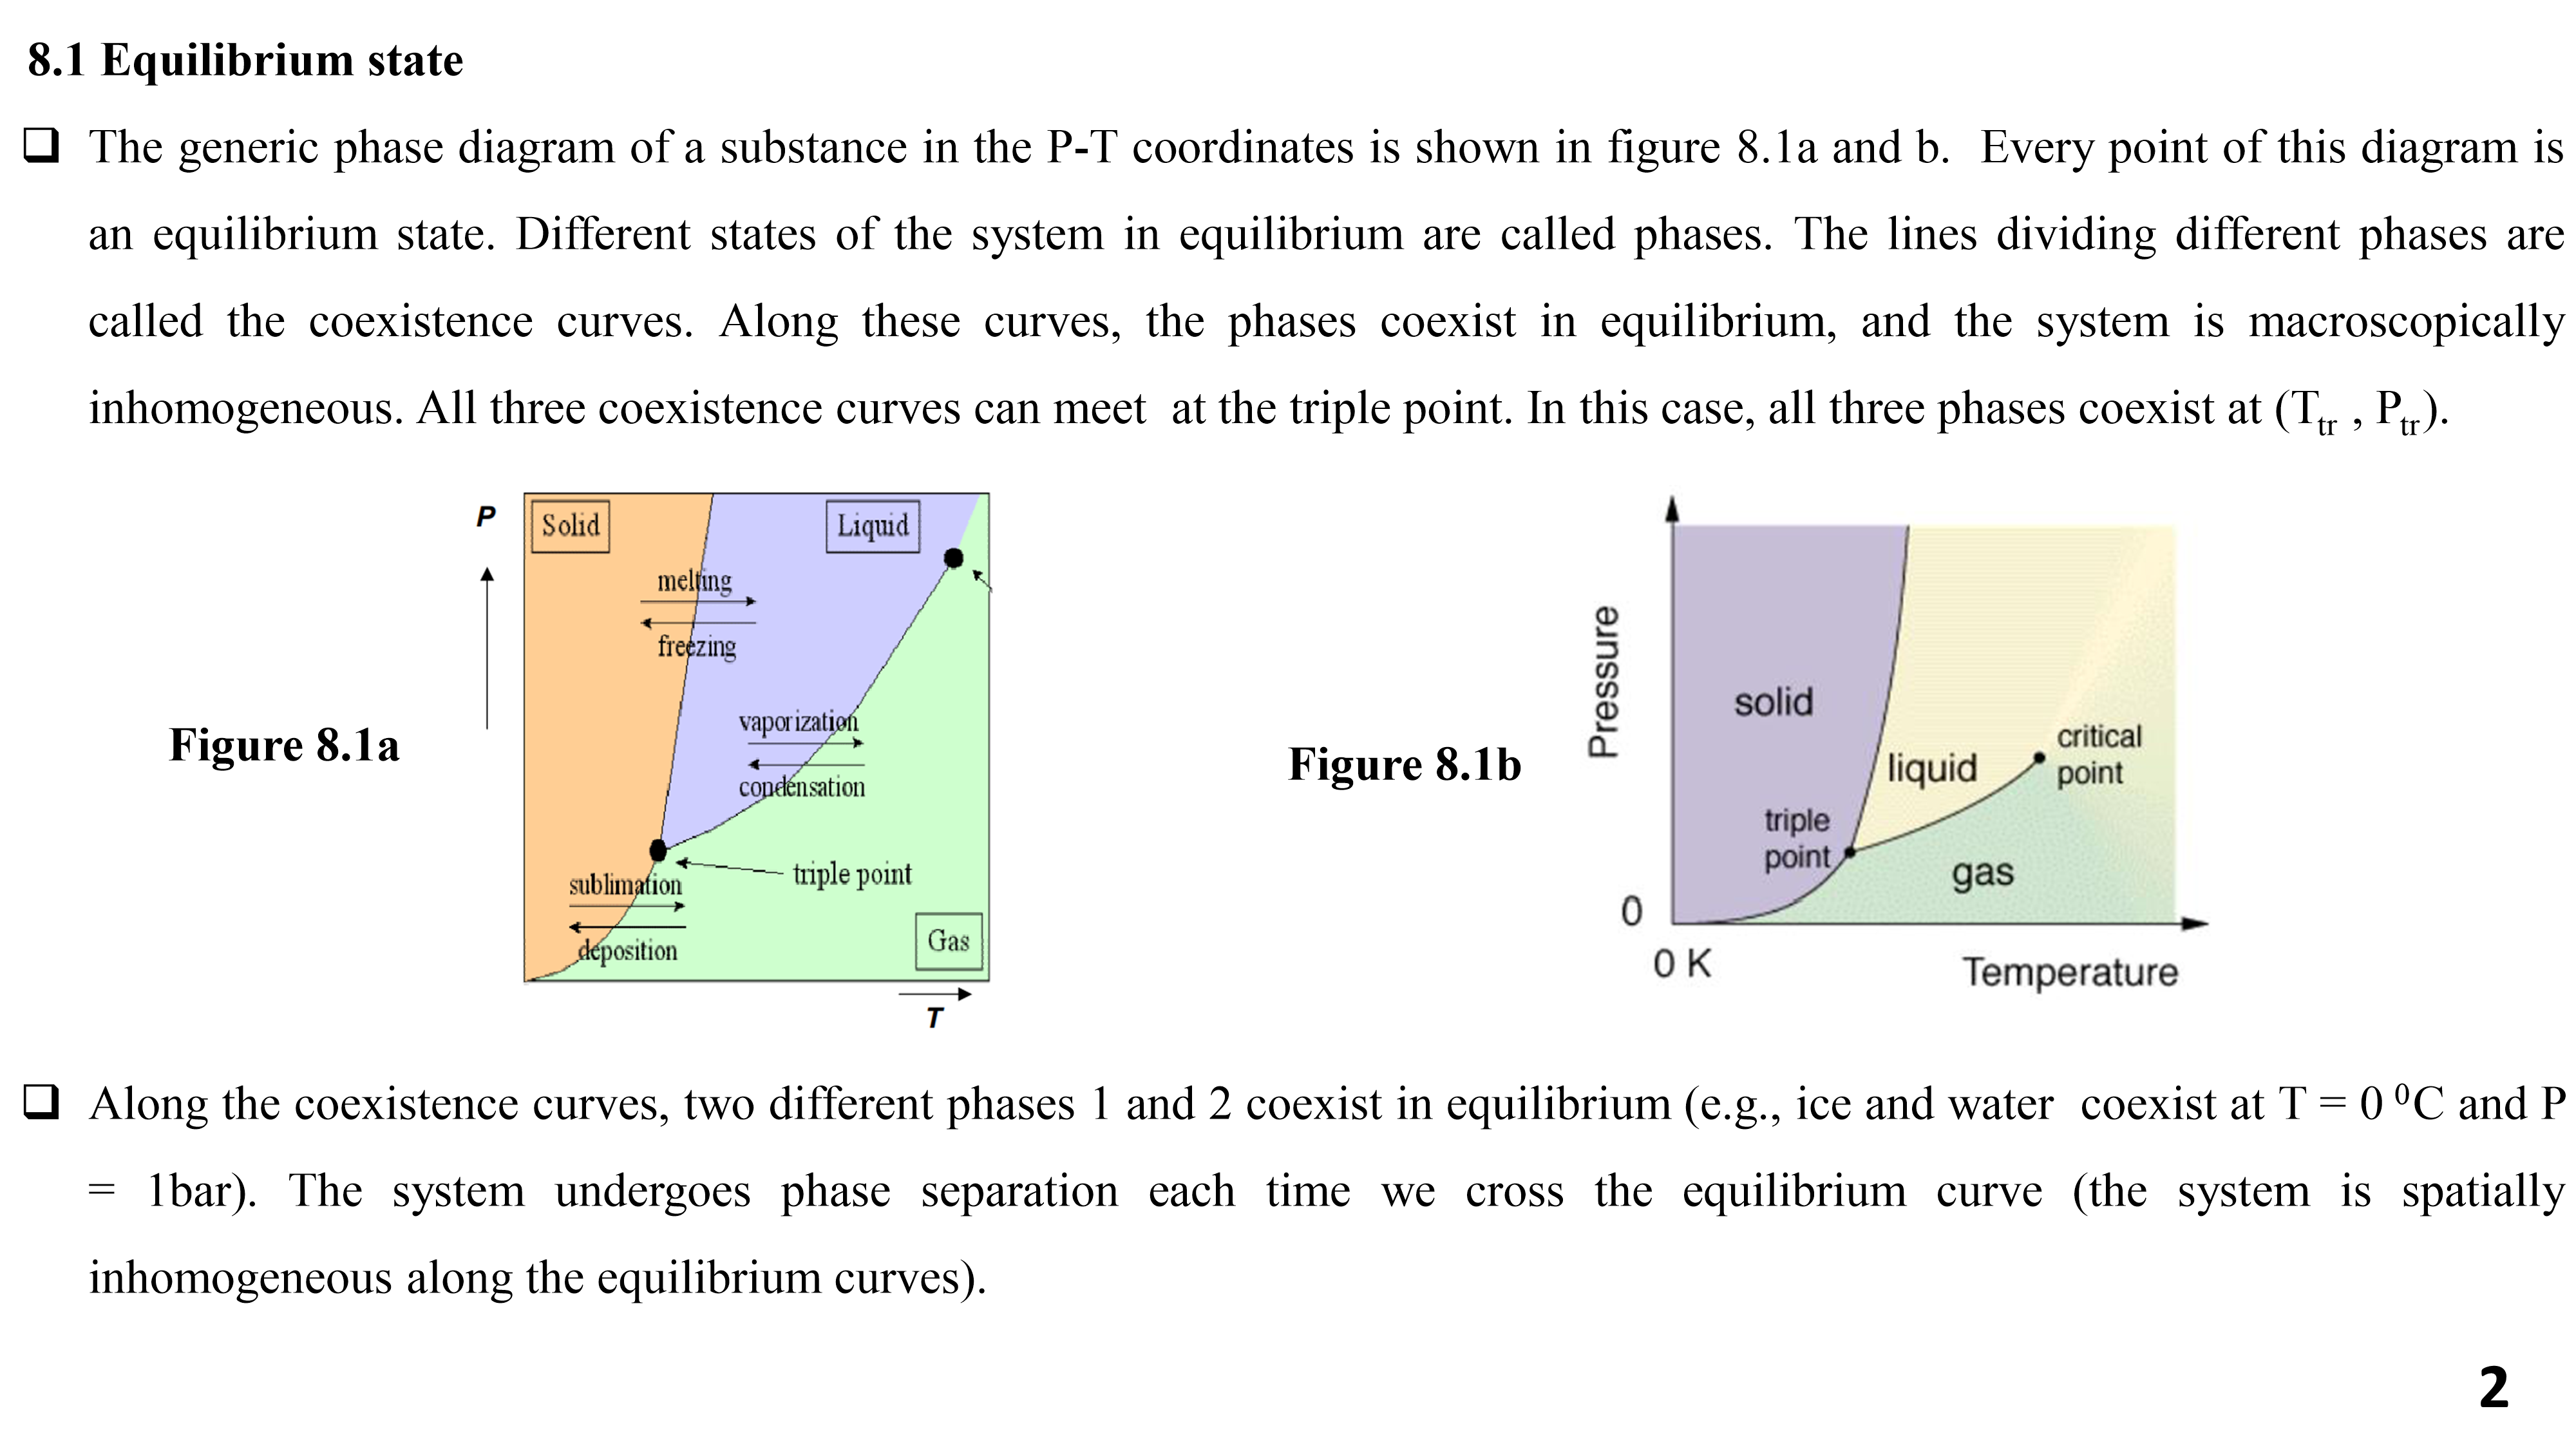
The generic phase diagram of a substance in the P-T coordinates is shown in figure 8.1a and b. Every point of this diagram is an equilibrium state. Different states of the system in equilibrium are called phases. The lines dividing different phases are called the coexistence curves. Along these curves, the phases coexist in equilibrium, and the system is macroscopically inhomogeneous. All three coexistence curves can meet at the triple point.
Below is the document preview.
AGRICULTURE SYLLABUS
Trending!
UPDATED KNEC AGRICULTURE SYLLABUS
23 Pages
10366 Views
2 Downloads
2.21 MB
HOMESCIENCE FORM 1 NOTES
Trending!
UPDATED HOMESCIENCE FORM 1 NOTES
147 Pages
10011 Views
4 Downloads
1.32 MB
K.C.S.E HRE SYLLABUS
Trending!
This is the comprehensive KNEC HRE SYLLABUS
10 Pages
8873 Views
0 Downloads
515.1 KB
K.C.S.E GERMAN SYLLABUS
Trending!
This is the comprehensive KNEC GERMAN SYLLABUS
No pages found
10502 Views
5 Downloads
60.04 KB
Isimu Jamii
Trending!
Isimujamii - Ni taaluma inayochunguza uhusianouliopo baina ya lugha na jamii.
Hasa hushughulikia jinsi watu wanavyotumia lugha katika jamii.
Isimu- ni uchunguzi wa lugha kisayansi.
Jamii – ni kundi filani la watu wenye uhusiano fulani.
24 Pages
5955 Views
3 Downloads
851.47 KB
FASIHI SIMULIZI NOTES
Trending!
Fasihi ni sanaa inayotumia lugha kuwasilisha ujumbe unaomhusu binadamu. Sanaa ni ufundi wa kuwasilisha fikra na hisia za binadamu kama vile maneno, maandishi,uchoraji, uchongaji, ufinyanzi n.k.
43 Pages
16228 Views
13 Downloads
752.59 KB